 Price Action: Trade What the Tape Shows
Structure, Wicks, Ranges & the Volume Footprint Explained
At the end of the day, every indicator, oscillator, or fancy script is just a translation of raw price. If you can read the tape directly—structure, wicks, ranges, and volume footprint—you don’t need to guess what’s going on. The chart is already telling you.
This guide will show you how to trade what the tape shows instead of what you hope will happen, using a simple framework built around price action you can apply to any market or timeframe.
1. What Is Price Action (and Why It Matters)?
Price action is simply how price moves—candle by candle, swing by swing, level by level. It’s the story of who is in control: buyers or sellers.
When traders talk about “reading the tape,” they’re really talking about watching how price interacts with:
- Structure: Higher highs/lows or lower highs/lows.
- Wicks: Where price was rejected intrabar.
- Ranges: Where price chops and accumulates.
- Volume footprint: Where size is actually trading.
2. Structure: Higher Highs, Lower Lows & Who’s in Control
The foundation of price action is structure—the sequence of swing highs and swing lows. A few simple rules already tell you a lot:
- Uptrend: Higher highs (HH) and higher lows (HL).
- Downtrend: Lower highs (LH) and lower lows (LL).
- Range: Price oscillates between clearly defined support and resistance.
Before you think about entries, indicators, or fancy patterns, ask:
- “Are we currently in an uptrend, downtrend, or range?”
- “Where is the last higher low or lower high?”
- “Is price breaking structure or respecting it?”
3. Wicks: Rejection, Liquidity & Trapped Traders
Candlestick wicks show you where price went but couldn’t stay. Long wicks often signal rejection or absorption of orders at certain prices.
Basic wick language:
- Long upper wick: Buyers pushed price up, but sellers smashed it back down → potential selling pressure.
- Long lower wick: Sellers dumped price down, but buyers stepped in hard → potential buying pressure.
- Repeated wicks at the same level: The level is being aggressively defended.
Combine wicks with structure and location:
- Long upper wicks into resistance in a downtrend → great short locations.
- Long lower wicks into support in an uptrend → great long locations.
4. Ranges: Where Smart Money Accumulates & Retail Gets Chopped Up
A range is a sideways zone where price keeps bouncing between support and resistance. Ranges are where a lot of traders get chopped up because they keep trading as if a trend is still active.
Key range types:
- Balance ranges: Clean horizontal highs and lows, volume building in the middle.
- Breakout ranges: Tight consolidation before a big move.
- Distribution/accumulation zones: Smart money building or unloading positions.
In a range, your job is to:
- Buy near the bottom of the range in an uptrend.
- Short near the top of the range in a downtrend.
- Avoid trading in the middle where risk/reward is terrible.
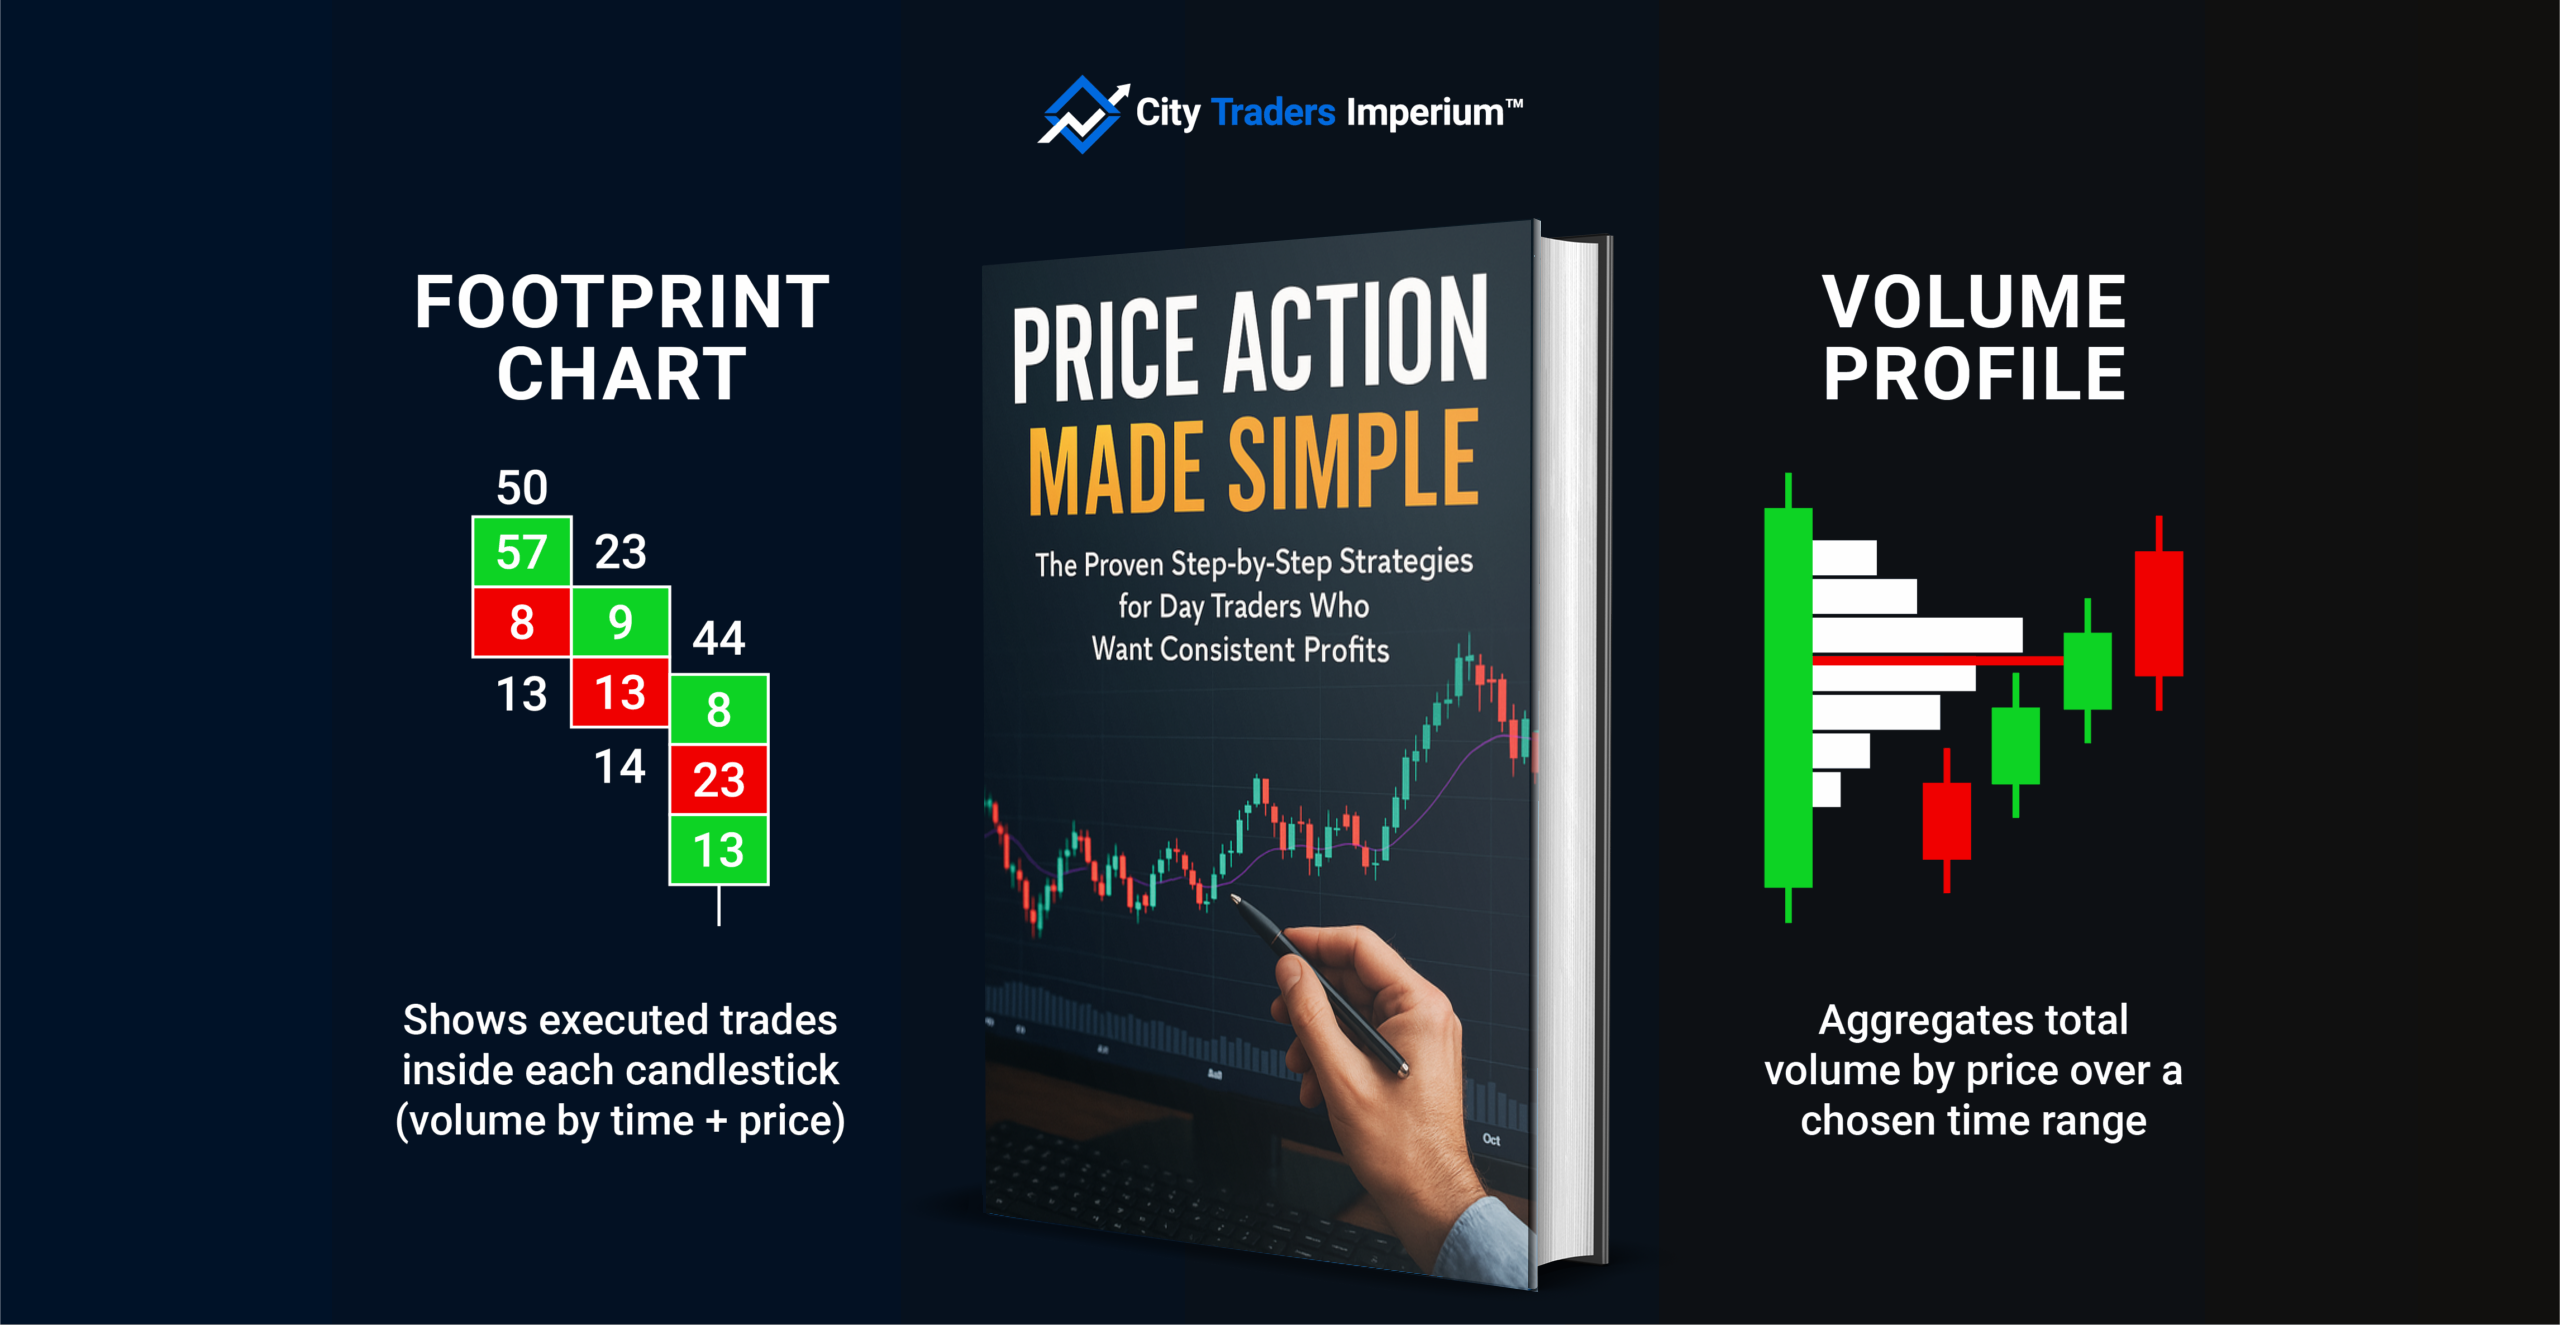
5. Volume Footprint: Where the Real Battle Is Happening
You don’t need an expensive footprint platform to understand the volume footprint of a move. At a basic level, you’re asking:
- “Where is volume increasing or drying up?”
- “Are big moves happening on strong or weak volume?”
- “Is volume confirming the breakout or fading out?”
Simple volume footprint clues:
- Big move + big volume: Strong conviction.
- Big move + tiny volume: Often a trap or thin liquidity push.
- Breakout above range + no volume: High odds of a failed breakout.
- Reversal candle + spike in volume: Strong signal that control is shifting.
Combine this with structure and wicks, and you’re now reading not just price, but who is behind the move.
6. A Simple Price Action Framework You Can Use Daily
Here’s a straightforward checklist you can follow on any chart, any timeframe:
-
Start with structure:
Are we trending up, trending down, or in a range? Mark the most recent HH/HL or LH/LL. -
Mark key levels:
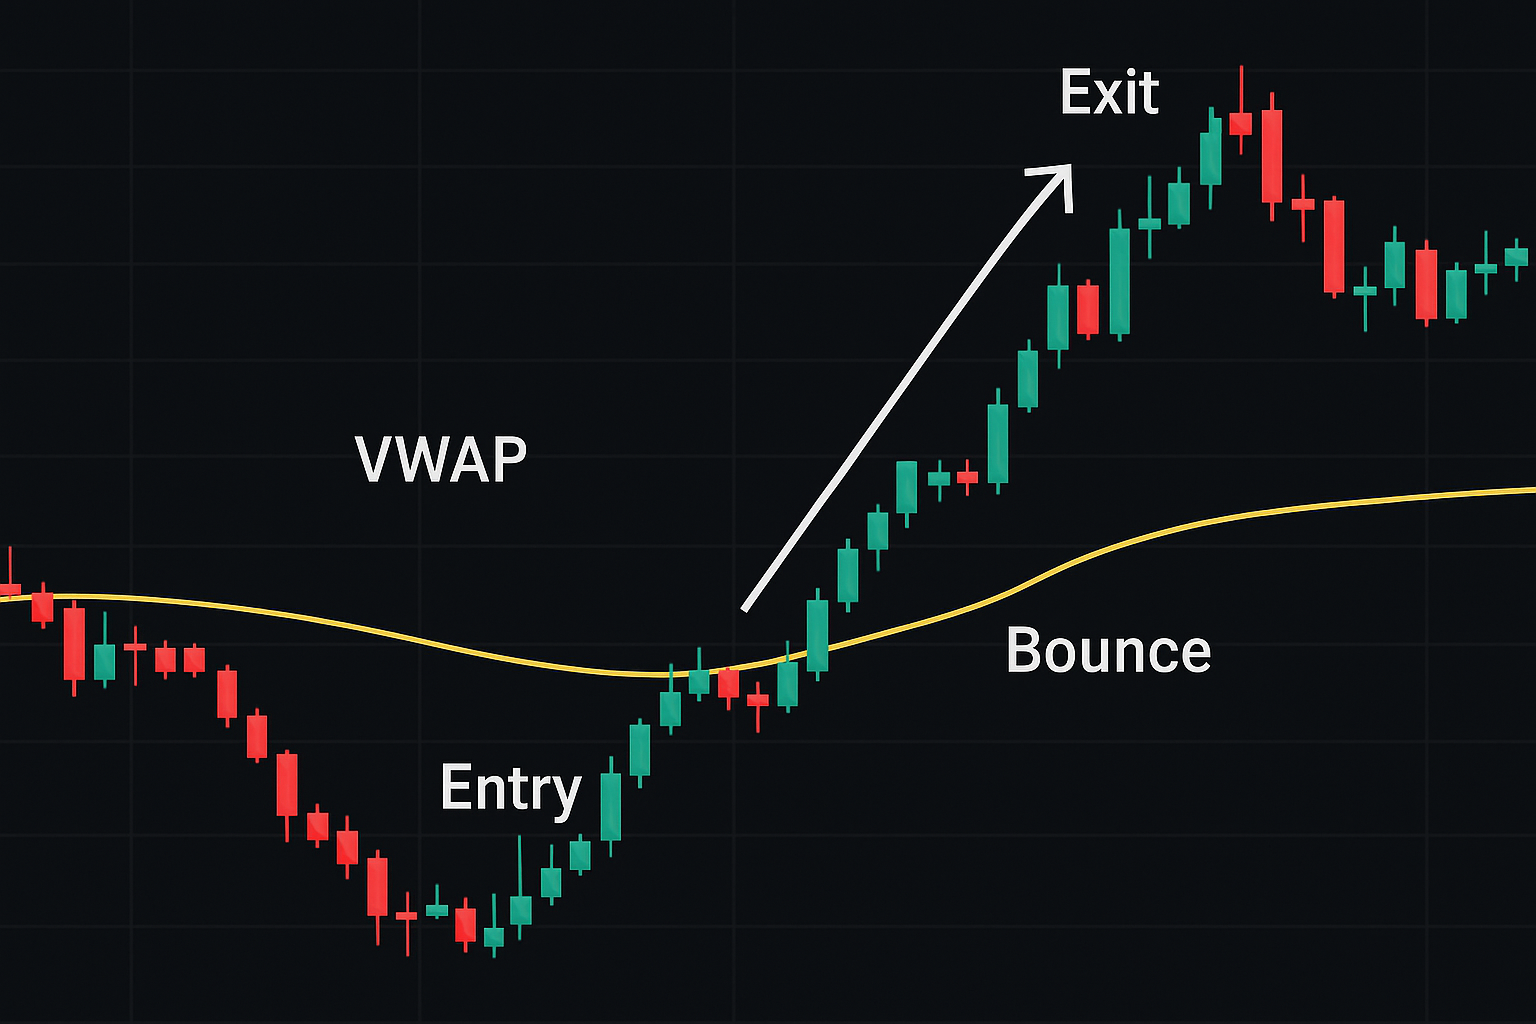
Daily highs/lows, VWAP, premarket levels, major support and resistance. -
Watch wicks at these levels:
Are we seeing rejection? Absorption? Does one side repeatedly fail? -
Check the volume footprint:
Is volume confirming or contradicting the latest push? -
Wait for a clear signal candle:
Engulfing, pin bar, inside bar break, or strong continuation bar from structure. -
Define your trade:
Entry at break of signal candle, stop beyond the wick or level, target at logical structure points.
7. Common Price Action Mistakes to Avoid
Even with a clean framework, it’s easy to slip into old habits. Watch out for these traps:
- Zooming in too much: Living on the 1-second or 5-second chart and forgetting the bigger trend.
- Ignoring context: Trading every pin bar the same, regardless of location or structure.
- Forcing trades in the middle of a range: Worst risk/reward on the chart.
- Chasing moves without volume confirmation: Often leads straight into reversals.
- Overloading with indicators again: If your chart looks like a Christmas tree, you’re not reading price—you're hiding from it.
The goal is to become fluent in price action, not to treat every candle pattern as a magical signal.
Final Thoughts: Trade What the Tape Shows, Not What You Hope
When you strip away the noise and focus on structure, wicks, ranges, and volume footprint, you start to see the market differently. You stop asking, “What do I think will happen?” and start asking, “What is the tape clearly showing me right now?”
That shift—from prediction to observation—is where real progress begins. Price action is not about perfection; it’s about consistently aligning yourself with the dominant side of the tape at logical locations with defined risk.
Build this into a routine, track it in your journal, and watch how much cleaner your trading decisions become.
📘 From VWAP Bounce to Profit — Your Price Action & VWAP Playbook
In From VWAP Bounce to Profit, I combine VWAP, price action, and simple risk rules into a full trading system you can follow each day. If you like the idea of trading what the tape shows—without cluttered indicators—this book is made for you.