 How to Read Price Action Like a Pro
Step-by-Step Trade Examples for Consistent Day Trading Profits
Ever stared at a chart packed with indicators and thought, “I still have no idea what’s going on”? That’s the trap most traders fall into.
Price action cuts through the noise. When you learn to read candles, levels, and structure, you don’t need ten indicators to tell you what the market is doing — the chart speaks for itself. In this post, we’ll break down how to read price action like a pro, using simple, step-by-step trade examples you can copy and practice.
1. What Is Price Action (And Why It Beats Indicator Overload)
Price action is simply how price moves over time — the swings, candles, and levels that show who is in control: buyers or sellers. Instead of lagging indicators, you’re reading:
- Higher highs and higher lows (uptrends)
- Lower highs and lower lows (downtrends)
- Support and resistance zones where price reacts
- Candlestick signals at key levels (rejections, breakouts, fake-outs)
Indicators can help, but they should confirm what you’re already seeing in price — not replace your ability to read the chart.
2. The 3 Core Building Blocks of Price Action
Before we get into trade examples, you need a clean mental framework. Focus on these three building blocks:
-
Trend: Is the market trending up, trending down, or chopping sideways?
Don’t fight the dominant direction on your trading timeframe. -
Key levels: Support, resistance, premarket highs/lows, prior day high/low, VWAP, etc.
This is where important decisions happen — entries, exits, and reversals. -
Candlestick reaction: How does price behave at those levels?
Strong rejection wicks, engulfing candles, tight consolidations, or heavy breakouts.
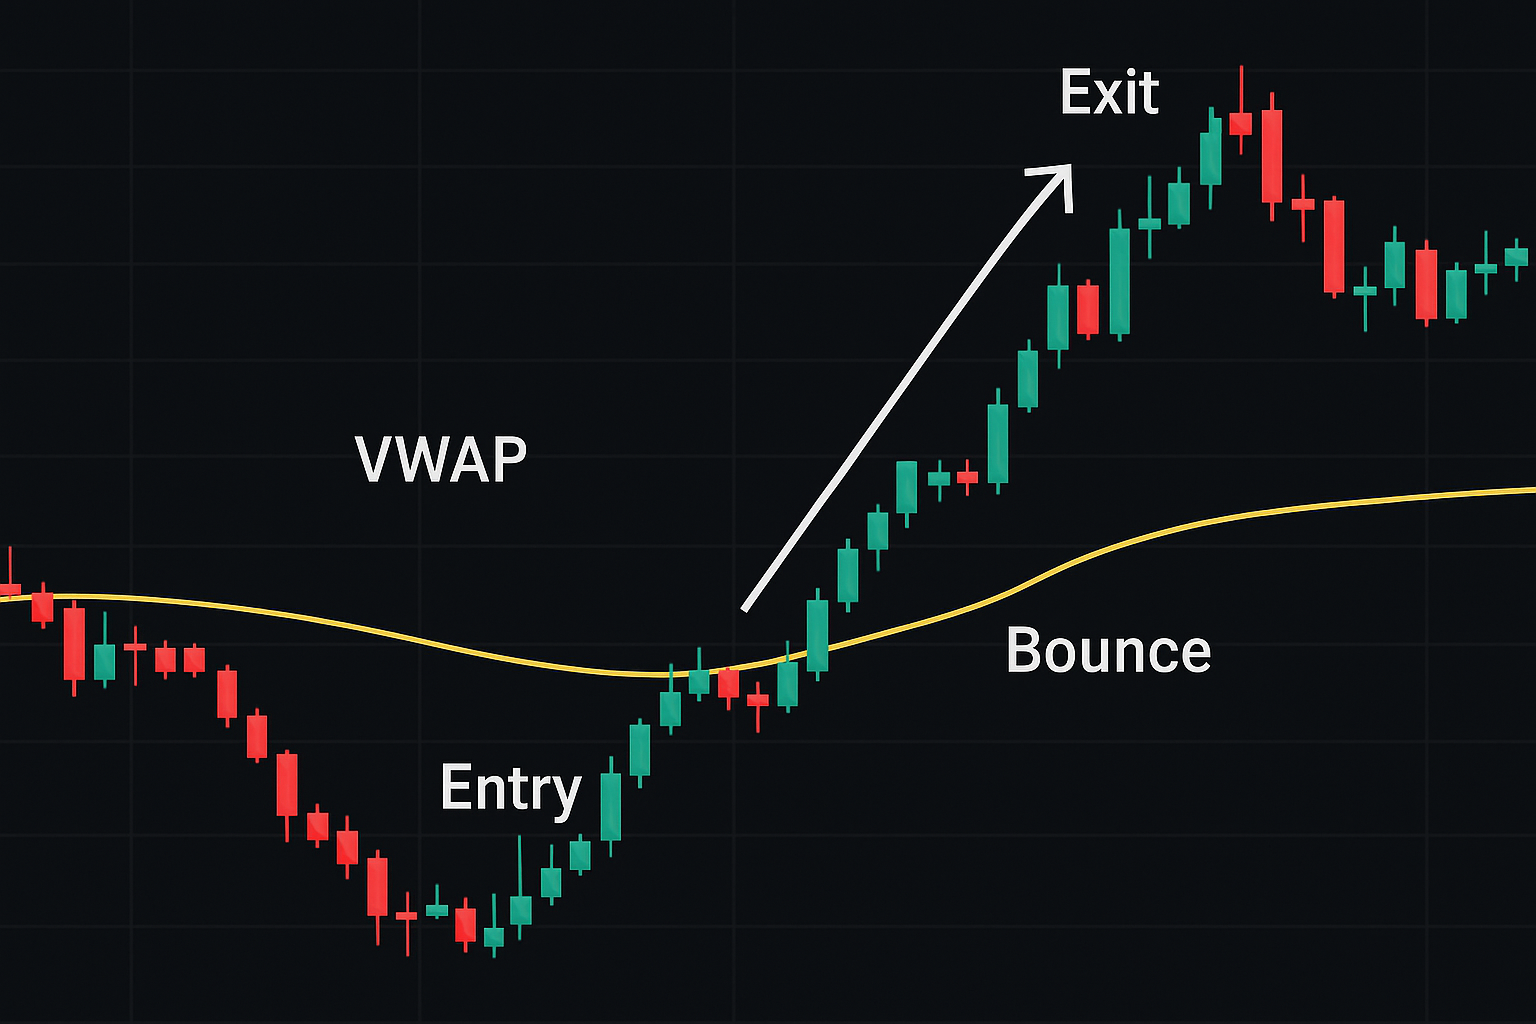
3. Step-by-Step Long Trade Example: Trend + Pullback + Break
Let’s walk through a simple long setup using pure price action. Imagine a stock at the open:
- Strong gap up on news
- First 15–30 minutes: higher highs and higher lows
- Price riding above VWAP (if you show it) and holding strong
Here’s the step-by-step process:
-
Identify the trend:
The stock is making higher highs and higher lows. Buyers are clearly in control — uptrend confirmed. -
Mark your key level:
You notice a clear intraday resistance where price has rejected twice (for example, $12.50). -
Wait for the pullback:
Instead of chasing the breakout, you wait for price to pull back to a prior support or mini-demand zone (like $11.90–$12.00). -
Look for confirmation candle:
At support, you get a strong bullish candle: long lower wick, strong close near the high, rejecting the level. -
Plan your trade:
Entry: above the confirming candle high.
Stop: below the wick/structure low.
Target: retest of resistance ($12.50) and extension above it if momentum continues. -
Execute without hesitation:
Once price breaks the candle high, you enter. No more second-guessing mid-trade.
That’s price action: trend + level + reaction. No signal service, no magic indicator. Just reading what the chart is telling you.
4. Step-by-Step Short Trade Example: Lower High + Breakdown
Now let’s flip the script. Imagine a stock that gapped down and is weak all morning:
- Lower highs and lower lows after the open
- Price repeatedly failing at VWAP from below
- Heavy selling volume on pushes up
Here’s how a clean short setup might unfold:
-
Confirm the downtrend:
Every bounce fails to break the prior high. Sellers are in control. -
Spot the lower high:
Price rallies into a prior support-turned-resistance level and stalls. Wicks form on the top of candles. -
Wait for breakdown trigger:
Price forms a small consolidation, then you see a strong bearish candle breaking that range to the downside. -
Plan your short:
Entry: below the breakdown candle low.
Stop: above the lower high / consolidation high.
Target: prior low of day, then next support zone below. -
Manage your risk:
If price snaps back and reclaims your breakdown level, you cut the trade — no “hoping it comes back.”
Again, no complicated overlay. You’re combining structure (lower highs), a key level, and a clear candle signal.
5. How to Use Candlestick Signals Without Overcomplicating Things
You don’t need to memorize 40 candlestick patterns. Focus on a few powerful signals at key levels:
- Rejection wicks: Long tails showing price tried to push through a level but was slammed back.
- Engulfing candles: A candle that fully engulfs the previous one, showing a shift in control.
- Inside bars: Consolidation candles that sit within the prior candle’s range, often before a break.
These candles mean very little in the middle of nowhere. They become powerful when they appear at a key level in the context of a clear trend.
6. Common Price Action Mistakes That Kill Trades
Most traders don’t lose because price action “doesn’t work.” They lose because they misuse it.
Watch out for these mistakes:
- Trading every pattern you see: Not every flag, wick, or engulfing bar is worth trading.
- Ignoring the higher timeframe: Taking longs on a micro pullback in a strong daily downtrend.
- Entering before confirmation: Anticipating a breakout before the candle closes and getting trapped.
- Forcing trades in chop: Price is sideways, but you’re hunting trends that aren’t there.
7. Building a Simple Daily Price Action Routine
To read price action like a pro, you need a repeatable routine — not random staring at charts.
-
Pre-market scan (10–20 minutes):
Identify gappers, news plays, and top volume names. Mark premarket highs/lows and major daily levels. -
Open observation (first 15–30 minutes):
Are we trending or chopping? Which stocks are strong or weak relative to the market? -
Mark intraday structure:
Draw key support/resistance zones, opening range highs/lows, and main swing points. -
Wait for your pattern:
Trend + pullback + confirmation, or lower high + breakdown, or tight consolidation at a level. -
Journal the trade:
Screenshot before and after, mark entries/exits, and write a short note about what the price action told you.
Final Thoughts: Price Action Is a Skill, Not a Shortcut
Reading price action like a pro won’t happen overnight. But if you commit to studying trends, levels, and candle reactions every day, your chart will stop looking like random chaos — and start looking like a story.
Focus less on new indicators and more on understanding what buyers and sellers are actually doing at each moment in time.
The goal isn’t to predict every move. It’s to recognize high-probability moments where the story is clear — and then execute with discipline.
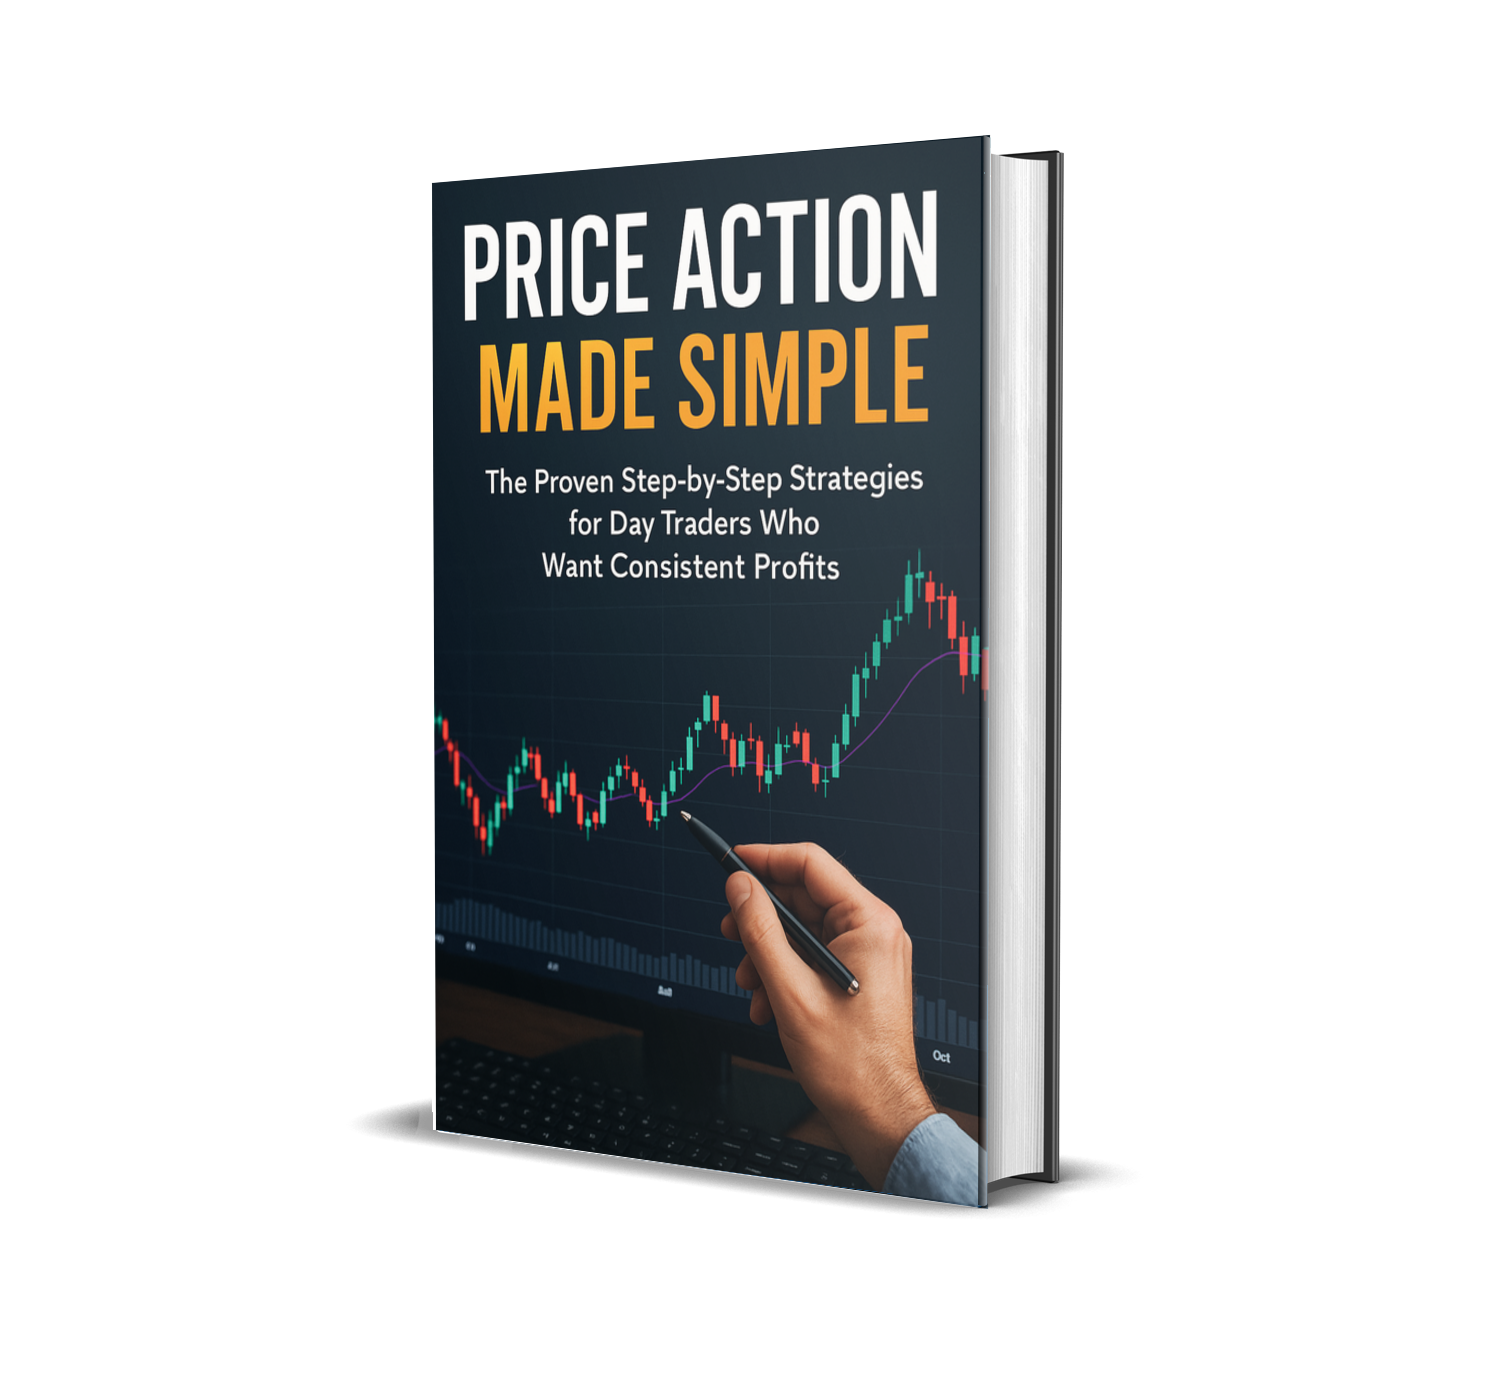
📘 Price Action Made Simple — Your Step-by-Step Playbook
Want to go deeper? In Price Action Made Simple, I walk you through structured price action setups, chart examples, and practice drills so you can move from guessing to confident, rules-based trading.